
Introduction
Formatting your range as a table tells Excel that those rows and columns are all related, and that there are headers in the first row. In this blog, we will show you different ways of creating a Table from a range, the flexibility to format quickly and what happens to your headers when you use Excel Tables! Excel version used here is Microsoft 365.
Now let's get started!!!
Ways to create TABLE from a range
1) Click the Format as Table button on the Home ribbon. This allows you to quickly apply the style that you want to use.
Image 1

OR
2) Click the Table button on the Insert Tab or type CTRL + T. The dialogue box (see, image 2) appears including your data range and an automatic check asking if your table has headers, Click OK. The default table style will be applied using the format, you can edit the table design ribbon for your chosen design. This is the quickest option!
Image 2

It gets better now that you are able to create a table, so don't stop there and let's dive in further to see some of the great benefits!
Some benefits of using Excel Tables
1) Flexibility in Formatting - Control the formatting of the entire range easily and the Excel Table will apply these to your range as your data expands over time (see, image 3). Easily format additional columns and rows without needing to reformat added information, therefore saving a lot of time. See image 3 and 4 below for demonstrations.
Image 3
The image below shows a data outside or excel table, column I and Row 46 shows additional information added to the data range but requires time to format the new row and column.

Image 4
The image below shows how the formatting is applied automatically to the range as the data expands over time.

2) Headers will remain visible on screen – with Tables, you no longer need to rely on freeze panes (you could still use it for columns). The headers are shown in the header section of the sheet as you scroll down (see image 5 ), however you need to click anywhere within the range for this to happen.
Image 5

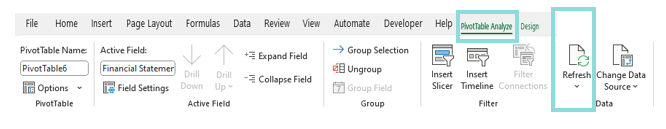
3) Update your pivot tables at the click of a button "REFRESH" - you can quickly update pivot tables created using Excel Tables in seconds! As you add more information to your data source, Excel Table captures the changes immediately when you click on Refresh via your PivotTable Analyse ribbon, eliminating the long-winded steps you need to follow for normal data ranges. Curious to see what we mean? Bet you are!
Click on the link below to access our Excel workbook and head to the sheet named TB (Excel Table) - Pivot to see some demonstrations.
Conclusion
Now you know how to create Excel Tables and understand its benefits, so why don't you go ahead and convert all your "normal data" within Excel to Tables. We have also attached our workbook for you to get stuck in if you would like to practice.
If you found this post useful, please leave us a message below and also provide details of what else you would like us to publish on our blog.
GOOD LUCK!
Click hyperlink below to download excel file.
Excel Tables and Pivot Workbook